Eleftherios Christou
Product Manager

Increasing User Interaction & Revitalizing Interest in a Photo Sharing App:
A Case Study of Aperture
The company
Aperture is a photo-sharing app with a variety of features, the app is designed to make sharing and enjoying photos easy and fun.
Key Product Features
Monthly Active Users: 500 million
Revenue Source: In-stream photo and video-based ads
Purpose
Aperture was my main's Product Management course case study at Career Foundry which helped me to deepen my understanding of what it means to be a product manager and gain the skills required to succeed in the role.
Problem Statement
Too many ads cause frustration to users while browsing and make the app unattractive, while users interact less with the app, the company faces low profitability that affects overall performance.
Objective
Increase user interaction and engagement for Aperture to maintain or increase revenue.
Credits: Mentor: Shehab Beram, Tutor: Aniket Parihar
Project scale: 3 months
Tools: Figma, Asana
Skills: value–damage quadrant
Target Market/Users
The original target market was teenagers and young adults aged 13 to 26, who were eager early adopters of the app. They were already sharing photos with friends through messages and other apps, making them likely to try new mobile technologies. Since its launch, Aperture has gained popularity across all age groups, though most users are still under 60.
Methodology
Step 1. Conducted Research
Prioritized research and created a high-level research plan.
I began by prioritizing my research, guided by assumptions and a value-damage quadrant.
This quadrant helped visualize the cost-benefit ratio aiding in the creation of a high-level research plan.
Assumptions
I additionally explain the rationale behind each choice and outline a high-level research plan for each selected assumption. This includes:
-
Research statement of each assumption
-
Research questions per research statement.
-
Results criteria per research statement.
-
An outline for the methods I’ve used to answer the research questions.
Click here for more details
Step 2. Organized Research & Data
I organised my research plan into milestones with specific activities
I created a task table by breaking down my research plan into specific activities, such as creating and conducting surveys, writing and conducting interview questions, and performing market research/competitor analysis. I assigned each specific activity to the corresponding stakeholder using the roles and stakeholder information from my project brief. I documented the types of stakeholders I would be working with next to the relevant activities in the spreadsheet and explained my rationale for choosing each stakeholder.
I also researched potential tools that could be used to complete each activity. While not every activity required a specific supporting tool, I considered this when planning. Finally, I estimated the time each activity might take to complete.
Task planning
Next, I used my project management skills and put together a timeline with all the key milestones. This helped me to see when each task needed to be finished, so we could deliver the product on time. I used Asana to create and manage this timeline, which helped the team stay organized, track progress, and manage their work effectively.
The order of Activities
Click here for more details
Timeline
Step 3. Analyzed research outputs
As a following step,I analyzed the review snippets and chart data provided for Aperture's three main competitors.
Competitor snippets and chart data here.
What method did i use and why?
As I had high visibility of data available, I used the comparison method to display the data and understand the differences between them.
From those observations, I was able to:
I list some of the most important observations (but not all) that I noticed from the charts and snippets:
Here is my detailed analysis.
Chart 1
I highlighted the growth in new users (in millions) for three competitors during 2020, 2021, and 2022. This information was beneficial to assess which competitor has been more successful by year.
-
It looks like Competitors A and B saw steady growth each year, but Competitor C didn’t follow the same pattern.
-
Competitor B’s new users jumped by almost 50% from 2020 to 2021. But in 2022, their growth dropped, adding only half as many new users as the year before.
Chart 2
I looked at how user interactions differ by age group. This helped me spot patterns and preferences for each age range.
-
the photo-sharing feature is used pretty consistently across all target groups.
-
people aged 18-24 click on ads less often than other age groups. Since ads are a key way for monetization, fewer clicks mean we can expect fewer purchases and lower revenue.
Chart 3
I looked at the exit survey data to understand what different age groups prefer. This helped me realise what improvements could potentially be made to keep more users from leaving the app.
-
performance issues are the least common reason users quit, no matter their age group.
-
what matters the most is that friends and family dont use the app which is major reason most of the users to leave.
Additional observations
After my observations, I outlined insights and key differences that helped me later on product decisions.
Here I outline the 4 most important obsertvations:
From these observations, I identified key insights, which I then prioritized using an Impact vs. Effort matrix based on their effort, time, and complexity.
High Impact, High Effort
1. Balance ad placement and monetization strategies: as photo sharing is main feature and youth ages Aperture's target group, it is necessary to implement tailored strategies to engage their interest and potentially generate more revenue.
2. enhance user experience: ensuring a positive user experience by minimizing the negative impact of ad clicking is essential for both user retention and long-term monetization.
3. prioritize feature development: it is a must to regularly update the app to add new features and improvements and ensure that the user experience aligns with the expectations of Aperture's target audience.
High Impact, Low effort
No Insight
Low Impact, High Effort
4. Enhance social integration to achieve increased engagement: 50% of survey respondents who leave the app due to inability connecting with their social cercle, it is a considerable number that grabs our attention. Although, even if the percentage is high, I place this insight in this category as this age group is currently not our target and we should need to focus more on strategies engaging the youth age group.
Low Impact, Low Effort
No Insight
After collecting observations and conclude with key insights, I created created a User persona to understand enable beter undesrtand users' needs, experiences, behaviors and goals.
User persona
"Ad clicking impacts the app experience negativelyfor our target group users"
Then, I also articulated all information for clarity in the value proposition canvas. In this way, I was able to understand deeper pains and gains of customers and focus on what matters. Tool: Miro
Value proposition canvas
Step 4. Generated & prioritized ideas
After completing the research phase, I conducted an ideation session with 5 course colleagues to generate, organize, and prioritize ideas. This step allowed me to showcase my collaboration skills in product management for the first time.
In the first part, I presented ideation topics to my colleagues team that represent pain points, optimization opportunities, growth areas, capabilities, or experiences. Then, I turned the ideation topics into HMW questions.
Ideation 1: Ad clicking impacts the app experience negatively for our target group users.
Ideation 2: Missing features is the major reason that pushes younger groups to leave the app.
See here for details:
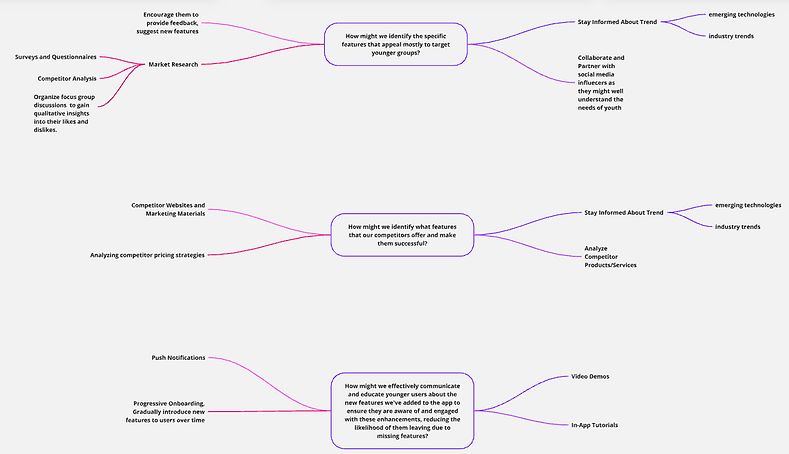
In the next step, I run an ideation session with the colleagues to generate ideas in response to the HMW questions.I used both Brainwriting and Mind mapping techniques to test how people respond in each way.
Brainwriting
Mind Mapping
At the end of the session, we came up with multiple ideas, although here I list the 3 most important:
Step 5. Idea selection
I selected scorecard method to encourage an analytical approach to prioritization
Scorecard metrics: Rating from 1(low) to 10(high)
• User Experience: on what scale the user experience will be improved.
• Cost: How costly this process will be.
• Implementation Effort: How much effort is required to implement the idea.
• Achievable Within Timeframe: Will the idea be achievable on time.
Scorecard
Results by priority
6. Solution
Using vibrant visuals to make ads more appealing
Benefits
Expected outcomes