Eleftherios Christou
Product Manager

The company
MakeYourMap is a mobile app that enables users to become map contributors, providing reviews, tips, and valuable information for popular points of interest on a specific map. Users can easily share these insights with their friends
Purpose
This project was created as part of my product management course at CareerFoundry to demonstrate mastery of the product lifecycle development.
The challenge
To research, design, and build product improvements to create user-generated content.
Problem
According to the survey, 80% of the audience stressed that they often use apps with interactive maps feature that enable them to design their routes online/offline. Make your map loses popularity and is not competitive as users sign up to viral apps for this feature.
The Goal
Users need to use interactive maps to plan and design their own routes, save points of interest and to get directions. The feature should have the capacity to function offline too.
Methods
Interviews, Surveys, Moscow, Miro, Zoom, Figma
Credits
Mentor: Shehab Beram, Tutor: Aniket Parihar
Research Methodology
To start the project, I conducted qualitative research to determine what potential contributors value in local guide apps and start developing ideas to improve the product.
The primary target users for MakeYourMap are:
Locals: Consumers who are interested in using Google Maps for their daily commute, looking up local restaurants/shops, and more.
Travelers: Consumers who are traveling somewhere and are interested in planning a trip, exploring new areas, looking up restaurants or interesting places to visit, and more.
Businesses: Businesses/organizations that want to advertise/highlight their presence on MakeYourMap or that are looking to add MakeYourMap capabilities to their product.
Contributors: Users who add content (reviews, photos, lists, place and street edits, and much more) to MakeYourMap.
Reviewers: The internal MakeYourMap team that reviews user-generated content and flags any abusive, incorrect, or low-quality content.
Tool: participants were found through a travel forum
Number of participants: 20
Step 1: Data analysis through survey questions
To start, I needed to prepare a set of open-ended questions to understand user's challenges, needs, and expectations while using local guide apps. Framing these questions was challenging for me. The survey was conducted through survey monkey and I had quick response from the contributors. Additionally, I contacted a research to validate how my suggested product improvements will impact user’s life. More info here.
1. What is your main goal when using a local guide app?
Find travel suggestions- 70% of participants
See pictures, upload pictures- 60% of participants
Read critics- 50% of participants
Connecting with people- 40% of participants
Check facts-25 % of participants
2. If you’ve used more than one local guide app, which do you prefer and why?
ToursByLocals- helps you find tours /guides in most of the coutries, multiple language selection, interactive maps
ShowAround- guide booking by the hour- it offers solutions on itineraries with tight schedule, offline functionality
FreeTours-focuses on the budget. Filtering by budget
3. How frequently do you use local guide apps?
Very frequently: 6 out of 20 people
Frequently: 7 out of 20 people
Often: 4 out of 20 people
Rarely: 3 out of 20 people
4. What are the best features of your local guide app?
User friendly and easy to navigate
Links and information on nearby attractions
Good Integration with the Social Media Platform
5. What are the worst features of your local guide app?
Weak Interactive Maps
Offline Functionality
No multilanguage option (English only)
No Real-time Updates
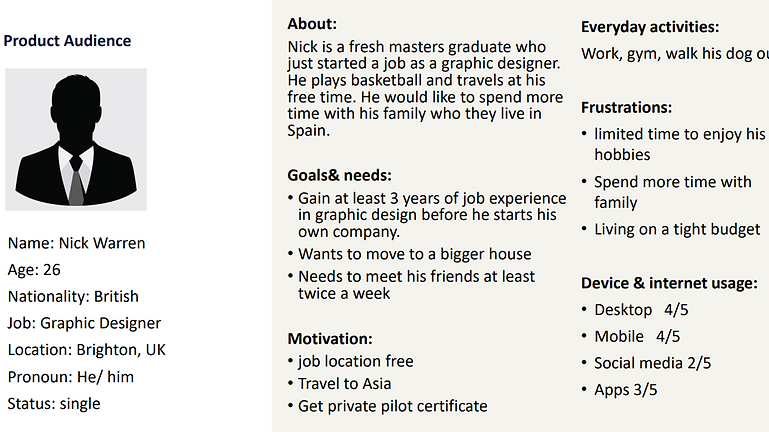
Step 2: Defining a User persona
The results of the user survey helped to identify needs and goals. On this basis, the development of a user persona was fun and easy to manage. Our user persona is a graphic designer whose main purpose is:
“As a user I want to be able to use interactive maps so that I can plan and design my own routes, save points of interest and to get directions.”
Key findings of this step: 5 new ideas for improvement
As a following step, I summarize the research results identifying any common themes and problems identified by the users. I labeled these themes as Strong, Medium or Weak based on their frequency. According to the survey, 80% of the audience stressed that they often use apps with interactive maps feature that enable them to design their routes online/offline.
Step 3: Solution prioritization MoSCoW
I chose the MoSCoW method because I had sufficient data points from prospective users and stakeholders to understand their exact needs. This approach allowed me to identify potential pain points before the launch and determine what is absolutely essential for our users. As a result, I was able to prioritize our product development efforts effectively. By ordering user stories based on priority, I refined the product backlog using the MoSCoW method.
To plan the tasks for the next sprint, I needed to know the available person-hours. Organizing this was challenging due to our limited team size and the tight timeframe. In the following link, I provide notes from my research data and context for my priority choice.
Suggestion on the 2 best features
Based on MoSCoW approach, I suggested the 2 best features to implement and explaining their essentiality for implementation both for users and business perspective.
1. Incorporating interactive maps will boost the competitive edge against other competitors. The feature will increase app’s popularity and increase trafficking by combining this essential feature with other existing that our users already love.This is the most essential implementation that needs to be applied as most of the users expressed their need to have the abillity designing their own routes within the app. Otherwise users tend to use competitive apps to satisfy their need.
2. Offline functionality is the second must have abillity of using interactive maps based on research. The user wants to be able to download specific map regions or areas for offline use, ensuring that they can access them without an internet connection. Additionally, the user desires the ability to save and store map data locally on their device, reducing reliance on internet connectivity for basic map functionalities.
Step 4: Wireframing & prototyping
For these 2 features, I created high-fidelity designs to understand the flow of user journey.
Prototypes built by using Miro
Feature 1: Interactive maps
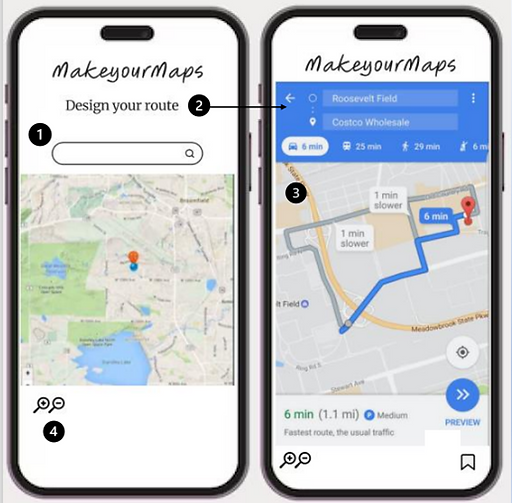
User story: As a user I want to be able to use interactive maps so that I can plan and design my own routes, save points of interest and to get directions. The application should provide an interactive map interface that allows the user to zoom in, zoom out, pan, and explore different locations. I designed this mid-wireframe to give the ability to users navigate the map, zoom in and out, and interact with it smoothly.
why?
By providing accurate and efficient directions on the map, this will enable users to input their starting point and destination and display the best routes with turn-by-turn instructions.
What the user journey looks like?
On top of the screen, there is a search bar (2) that the user can type the point of interest and design a route (3) as can be seen in the second sketch. The user can see the exact route with addresses and time of the route according to the way of travel. Additionally, a zoom in/out button (4) appears at the bottom left side of the screen.
Feature 2: Offline functionality
User story 2: As a user, I want to be able to download specific map regions or areas for offline use, ensuring that I can access them without an internet connection. Also, I want the ability to save and store map data locally on my device, reducing the reliance on internet connectivity for basic map functionalities. In this wireframe, we can see how the users can view their current location, search for points of interest, and plan routes even when offline.
why?
This is necessary as it will enhance the user experience, especially in situations where there is limited or no internet connectivity.
What the user journey looks like?
In the main screen, we implemented the pin button (1) that allows the user to save a destination route. The downloaded button (2) allows the user to find the saved downloaded maps as appeared in the screen (3).
Objectives and Measures of Progress
O: Enhance User Experience through the Implementation of Interactive Maps
KR1: Increase User Engagement:
1. Increase the average session duration by 20% on interactive maps.
2. Achieve a 15% increase in the number of users actively interacting with the maps (e.g.,zooming, panning, clicking on markers).
KR2: Improve User Satisfaction:
1. Attain a user satisfaction rating of 4.5 out of 5 in post-implementation surveys.
2. Reduce the bounce rate on pages with interactive maps by 10%.
KR3: Expand Geographic Coverage
Increase the coverage of interactive maps to include at least five additional regions or countries.
KPI1: Measure the average time spent on interactive maps per user session
KPI2: Conduct regular user satisfaction surveys to measure the rating of interactive maps.
KPI3: Track the number of user interactions (e.g., zooming, panning, search) with the interactive maps
💡Κey takeaways
This project marked my introduction to applying product management methodology. Initially, I struggled to secure survey responses due to people's busy work schedules. However, I persevered and eventually collected feedback from the majority of participants. The Moscow prioritization technique was already familiar to me, having studied it theoretically during my degree.
Looking ahead, I aim to enhance my skill set by investing more time in developing my Figma wireframing skills, recognizing its frequent use in tasks. Constructing this project was enjoyable, and I owe my success to the guidance of my mentors, who provided valuable insights applicable to real-life projects.